In support of MCC’s mission of “Preparing students, serving communities, creating opportunities for all”, the College monitors student performance via key student achievement outcomes. These data are supplemented by Key Performance Indicators (KPIs) tied to the strategic plan.
The student achievement outcomes serve as standing measures of MCC’s effectiveness in fulfilling its mission.
Course Completions
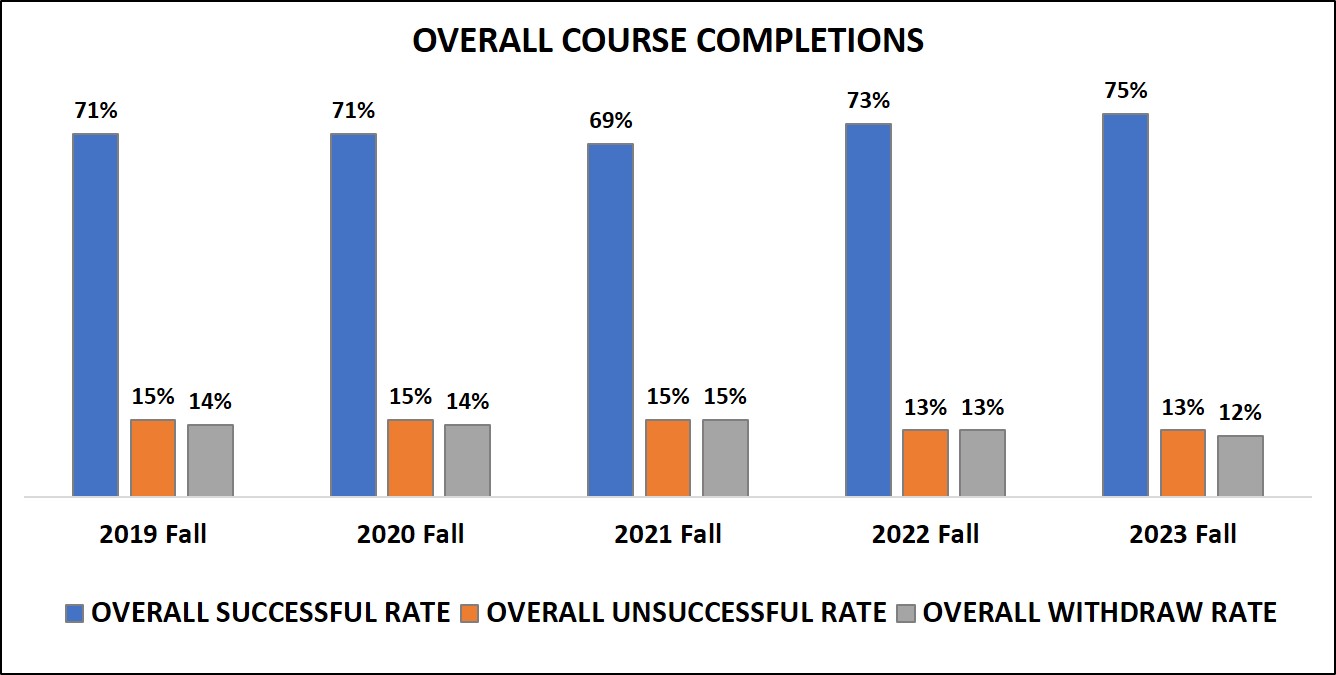
Notes: Successful Grades = A, B, C, S; Unsuccessful Grades = D, F, U; Course Withdrawal = W; Excluded Grades = AU, I, JC, KC; Includes Degree-Seeking students only; Excludes students who are exclusively Dual Credit
Source: Insights; Date: March 2026
Student Retention
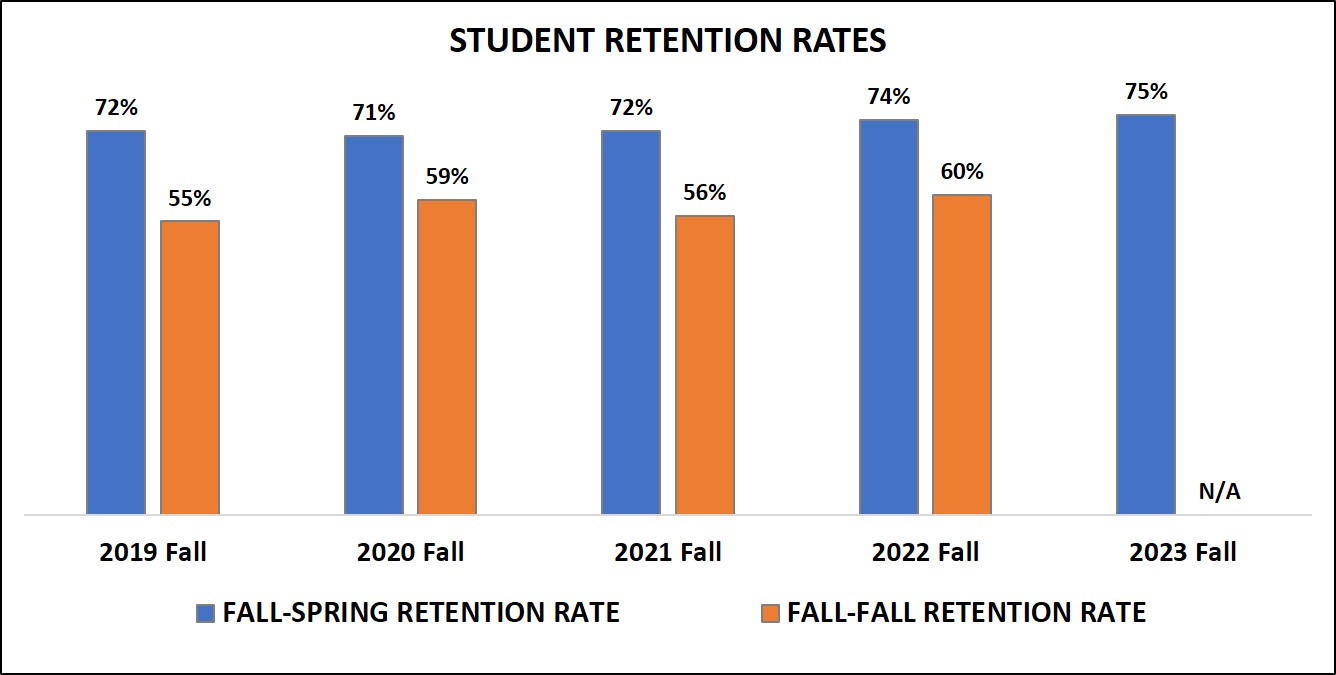
Notes: Includes Degree-Seeking students only; Excludes students who are exclusively Dual Credit; Fall 2025-Spring 2026 Retention is included, though the Spring 2026 term was not complete at the time of data collection
Retention Definitions: Fall to Spring Retention is defined as non-completer students from the specified fall term who enrolled in the subsequent spring term, plus those who completed a degree or certificate in the specified fall term. Fall to Fall Retention is defined as non-completer students from the specified fall term who enrolled in the subsequent fall term, plus those who completed a degree or certificate in the specified fall term or subsequent spring and summer terms.
Source: Insights; Date: March 2026
3-Year Completion Rates
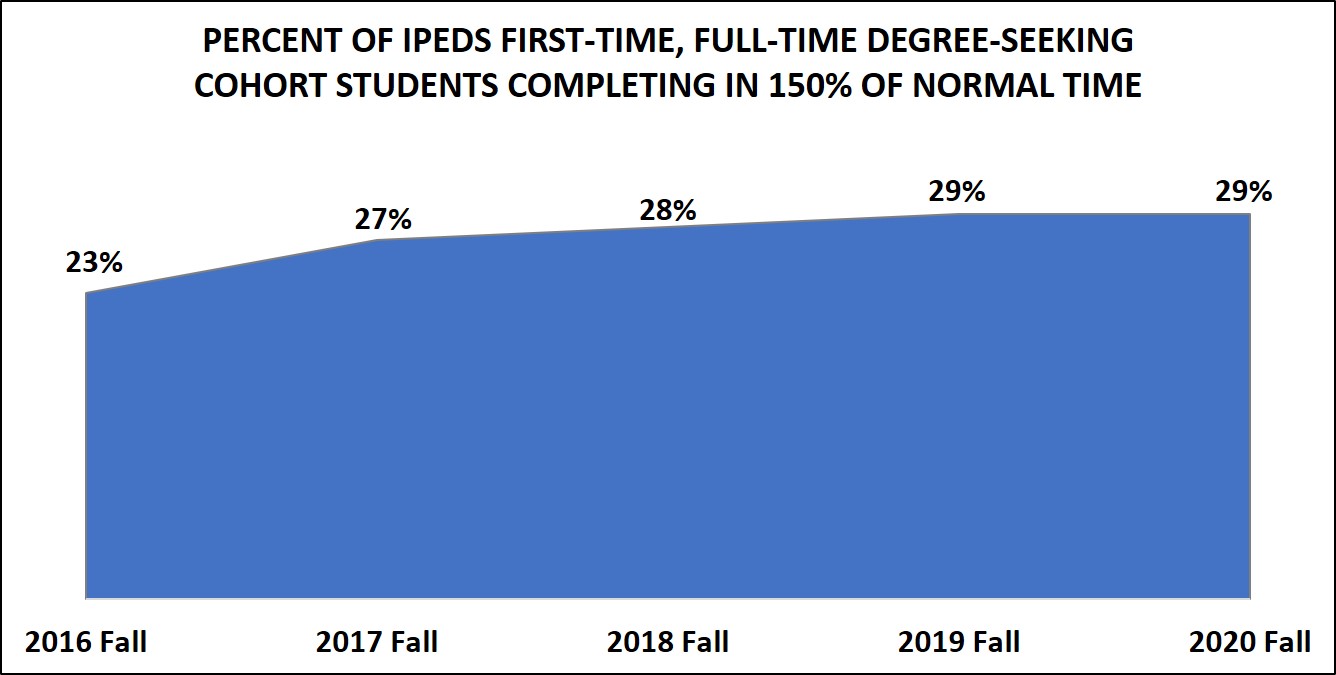 Notes: Fall Cohorts are the IPEDS defined cohort of First-Time, Full-Time, Degree-Seeking
students. Cohorts are based on enrollment on State Aid Day as per IPEDS reporting
instead of End of Term. Completion rate is defined as 150% of normal time to complete
the degree or certificate. For example, the normal completion time for an Associate
of Arts degree is two academic years, so the 150% of normal time is three academic
years.
Notes: Fall Cohorts are the IPEDS defined cohort of First-Time, Full-Time, Degree-Seeking
students. Cohorts are based on enrollment on State Aid Day as per IPEDS reporting
instead of End of Term. Completion rate is defined as 150% of normal time to complete
the degree or certificate. For example, the normal completion time for an Associate
of Arts degree is two academic years, so the 150% of normal time is three academic
years.
Source: IPEDS Graduate Queries; Date: March 2026
Technical Skills Assessments Pass Rates
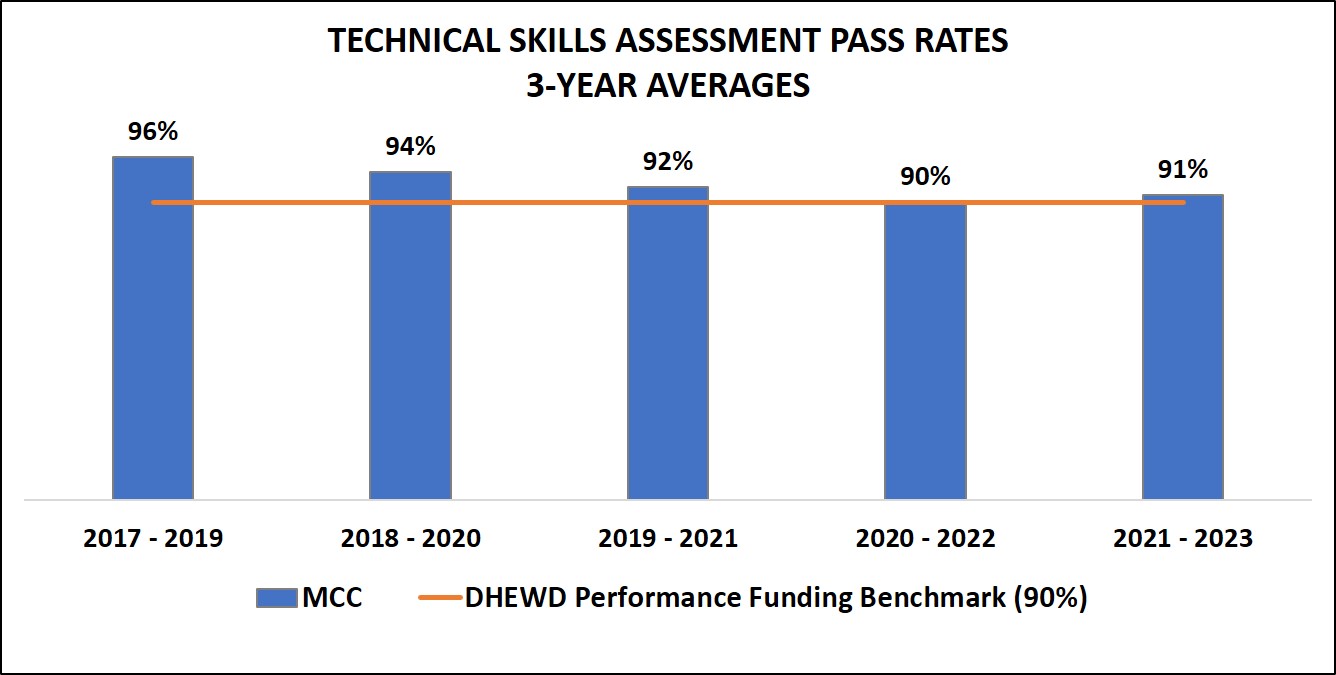
Notes: Percentages represent the three-year rolling average as reported to, and calculated by, the Missouri Department of Higher Education and Workforce Development (DHEWD). The three-year rolling average benchmark established by DHEWD is 90%. Please note not every program requires a Technical Skills Assessment.
Source: MCC Program Coordinators reported data compiled by the Office of Institutional Research and Analytics; Date: March 2026
Employment Placement Rates
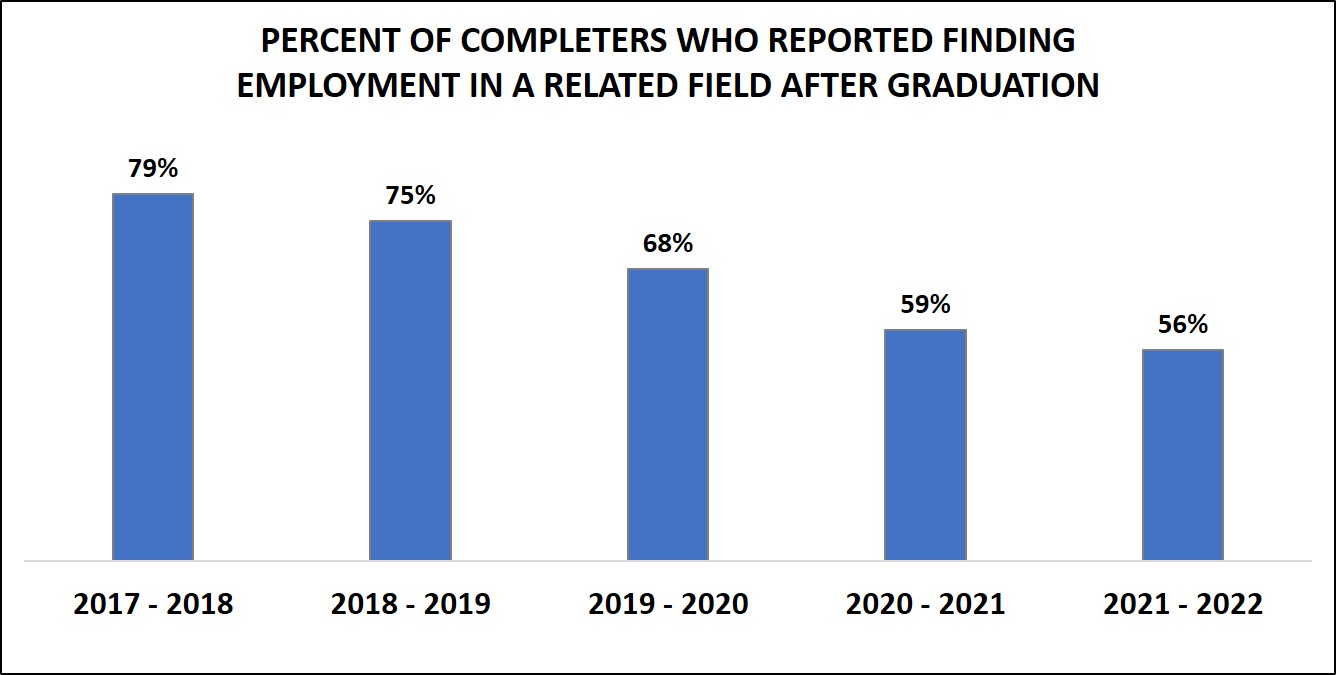
Notes: Percentages are of students who completed a degree or certificate in a Perkins approved Career & Technical program and who responded to the Graduate Follow Up Survey as finding employment within a related field. Numbers are reported each year in accordance with compliance for Perkins funding.
Source: Graduate Follow Up Survey along with additional follow up data from Career and Program Coordinators compiled by the Office of Institutional Research and Analytics; Date: March 2026
Completers Who Transfer to 4-Year Institutions
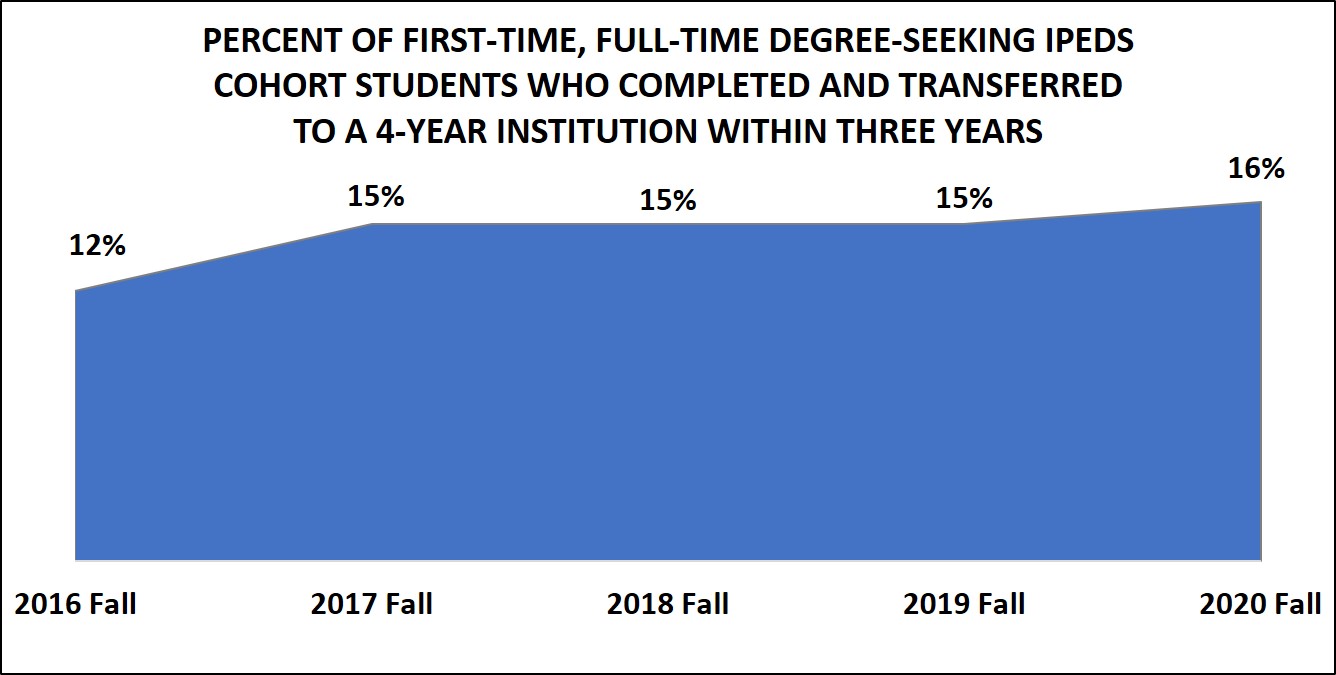
Notes: Fall Cohorts are the IPEDS defined cohort of First-Time, Full-Time, Degree-Seeking students. Cohorts are based on enrollment on State Aid Day as per IPEDS reporting instead of End of Term. Numbers and percentages represent the number of students within the specified cohort who both completed a degree or certificate and transferred to a 4-year institution within three years.
Source: Fall Enrollment IPEDS query and National Student Clearinghouse results compiled by the Office of Institutional Research and Analytics; Date: March 2026